
MySQL运行时的可观测性 观察MySQL运行时的可见性(4)
MySQL运行时的可观测性
我们知道,运行完一条SQL后,可以利用PROFLING功能查看它各个阶段的耗时,但是在运行时如果也想查看各阶段耗时该怎么办呢?
从MySQL 5.7版本开始,可以通过performance_schema.events_stages_%相关表查看SQL运行过程以及各阶段耗时,需要先修改相关设置:
# 确认是否对所有主机&用户都启用
greatsql> SELECT * FROM performance_schema.setup_actors;
+------+------+------+---------+---------+
| HOST | USER | ROLE | ENABLED | HISTORY |
+------+------+------+---------+---------+
| %    | %    | %    | NO      | NO      |
+------+------+------+---------+---------+
# 修改成对所有主机&用户都启用
greatsql> UPDATE performance_schema.setup_actors
 SET ENABLED = 'YES', HISTORY = 'YES'
 WHERE HOST = '%' AND USER = '%';

# 修改 setup_instruments & setup_consumers 设置
greatsql> UPDATE performance_schema.setup_consumers
 SET ENABLED = 'YES'
 WHERE NAME LIKE '%events_statements_%';

greatsql> UPDATE performance_schema.setup_consumers
 SET ENABLED = 'YES'
 WHERE NAME LIKE '%events_stages_%';
这就实时可以观测SQL运行过程中的状态了。
在SQL运行过程中,从另外的窗口查看该SQL对应的EVENT_ID:
greatsql> SELECT EVENT_ID, TRUNCATE(TIMER_WAIT/1000000000000,6) as Duration, SQL_TEXT        FROM performance_schema.events_statements_history WHERE thread_id = 85 order by event_id desc limit 5;
+----------+----------+-------------------------------------------------------------------------------------------------------------------------------+
| EVENT_ID | Duration | SQL_TEXT                                                                                                                      |
+----------+----------+-------------------------------------------------------------------------------------------------------------------------------+
|   149845 |   0.6420 | select emp_no, sum(salary) as total_salary, sleep(0.000001) from salaries group by emp_no order by total_salary desc limit 10 |
|   149803 |   0.6316 | select emp_no, sum(salary) as total_salary, sleep(0.000001) from salaries group by emp_no order by total_salary desc limit 10 |
|   149782 |   0.6245 | select emp_no, sum(salary) as total_salary, sleep(0.000001) from salaries group by emp_no order by total_salary desc limit 10 |
|   149761 |   0.6361 | select emp_no, sum(salary) as total_salary, sleep(0.000001) from salaries group by emp_no order by total_salary desc limit 10 |
|   149740 |   0.6245 | select emp_no, sum(salary) as total_salary, sleep(0.000001) from salaries group by emp_no order by total_salary desc limit 10 |
+----------+----------+-------------------------------------------------------------------------------------------------------------------------------+
# 再根据 EVENT_ID 值去查询 events_stages_history_long
greatsql> SELECT thread_id ,event_Id, event_name AS Stage, TRUNCATE(TIMER_WAIT/1000000000000,6) AS Duration  FROM performance_schema.events_stages_history_long WHERE NESTING_EVENT_ID = 149845 order by event_id;
+-----------+----------+------------------------------------------------+----------+
| thread_id | event_Id | Stage                                          | Duration |
+-----------+----------+------------------------------------------------+----------+
|        85 |   149846 | stage/sql/starting                             |   0.0000 |
|        85 |   149847 | stage/sql/Executing hook on transaction begin. |   0.0000 |
|        85 |   149848 | stage/sql/starting                             |   0.0000 |
|        85 |   149849 | stage/sql/checking permissions                 |   0.0000 |
|        85 |   149850 | stage/sql/Opening tables                       |   0.0000 |
|        85 |   149851 | stage/sql/init                                 |   0.0000 |
|        85 |   149852 | stage/sql/System lock                          |   0.0000 |
|        85 |   149854 | stage/sql/optimizing                           |   0.0000 |
|        85 |   149855 | stage/sql/statistics                           |   0.0000 |
|        85 |   149856 | stage/sql/preparing                            |   0.0000 |
|        85 |   149857 | stage/sql/Creating tmp table                   |   0.0000 |
|        85 |   149858 | stage/sql/executing                            |   0.6257 |
|        85 |   149859 | stage/sql/end                                  |   0.0000 |
|        85 |   149860 | stage/sql/query end                            |   0.0000 |
|        85 |   149861 | stage/sql/waiting for handler commit           |   0.0000 |
|        85 |   149862 | stage/sql/closing tables                       |   0.0000 |
|        85 |   149863 | stage/sql/freeing items                        |   0.0000 |
|        85 |   149864 | stage/sql/logging slow query                   |   0.0000 |
|        85 |   149865 | stage/sql/cleaning up                          |   0.0000 |
+-----------+----------+------------------------------------------------+----------+上面就是这条SQL的运行进度展示,以及各个阶段的耗时,和PROFILING的输出一样,当我们了解一条SQL运行所需要经历的各个阶段时,从上面的输出结果中也就能估算出该SQL大概还要多久能跑完,决定是否要提前kill它。
以上就是IT袋网带来的MySQL运行时的可观测性的IT小经验,希望能为您在生活中带来帮助!

相关阅读
-

虚拟化ESXi常见故障问题及解决方案
为网友们详解虚拟化ESXi常见故障问题及解决方案的介绍,相关内容具体如下: 一、 针对VMWare集群相关问题 1.1 问题 1) ESXi集群资源不足,存在很多虚拟机,配置很高,资源利用率很低;业务
-
vSphere之VMkernel网络层
今日重点为您介绍vSphere之VMkernel网络层方面的内容,请看下面详细的介绍。 VMkernel 网络层用于VSS(标准交换机),提供与主机的连接,并处理 vSphere vMotion、IP 存储、Fault Tolerance、vSAN 等其他服
-
广域网 WAN的主要特点是什么
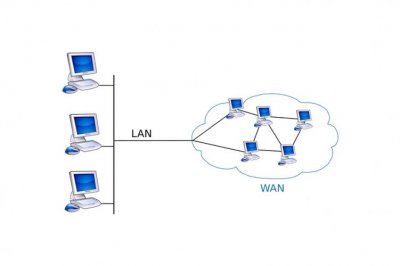
如果想知道的相关介绍,接下来IT袋网小编为大家介绍。 广域网(Wide Area Network)跨越更大的地理区域,通常连接不同城市、国家甚至大洲的设备。 特点 广泛范围: WAN的范围非常广泛,可以连
-

UDP是什么协议? UDP的主要特点和功能
为网友们详解UDP是什么协议的相关经验,接下来IT袋网带大家一起了解。 UDP(用户数据报协议,User Datagram Protocol)是一种传输层协议,用于在网络中的两个节点(例如计算机、服务器等)之间